Home → Blog → How Does Your Pay Compare in Calgary? A Wage Gap by Industry Story
How Does Your Pay Compare in Calgary? A Wage Gap by Industry Story
A simple way to compare your hourly wage with your industry average, the Calgary average, and recent wage trends.
TL;DR · Summary
- Many people know their own pay, but have no clear benchmark for how it compares across Calgary.
- In this example, a $36/hour wage in Professional, Scientific and Technical Services is well below the industry average of $51.70.
- That same wage is only slightly below the overall Calgary average of $40.60.
- The industry itself is large, with about 95.9k workers, or 11.0% of all industries.
- This post links to a YYC-Wander wage tool so you can check your own numbers by industry.
- Data source:
- Official labour market data used in the YYC-Wander wage comparison tool
- Calgary hourly wage by industry, trend, and employment size
This post is for general informational purposes only and should not be treated as wage or career advice.
1) Most people know their pay, but not their benchmark
Most workers in Calgary know roughly what they earn per hour.
But many do not know how that number compares with their own industry.
And even fewer know how their industry compares with Calgary as a whole.
That gap matters, because pay only becomes meaningful when it has context.

2) A real example from Calgary
Let’s take one example from Professional, Scientific and Technical Services.
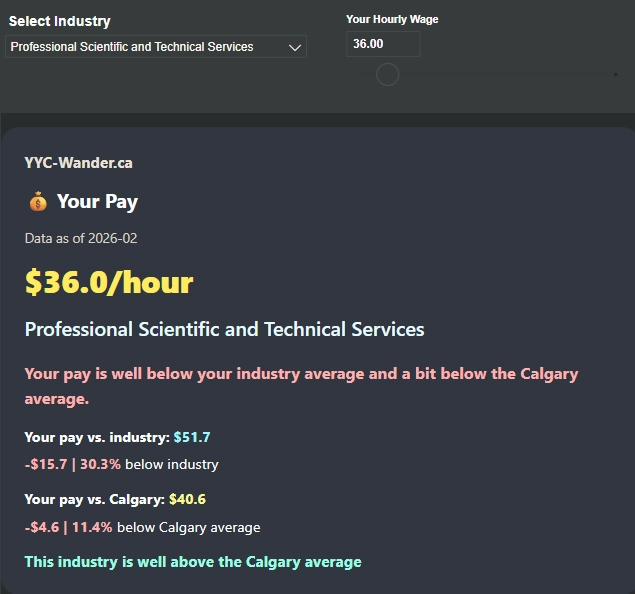 In this example, the selected hourly wage is $36.00.
The tool compares that number against both the industry average and the city average.
- Your pay: $36.00/hour
- Industry average: $51.70/hour
- Calgary average: $40.60/hour
That means this wage is:
- $15.70 lower than the industry average, or about 30.3% below it
- $4.60 lower than the Calgary average, or about 11.4% below it
What stands out here is that the worker is not just below a premium industry benchmark. They are also slightly below the city-wide average.
3) The trend matters too
A single wage number only tells part of the story. Trend matters.
The same tool also shows how the industry has changed over time.
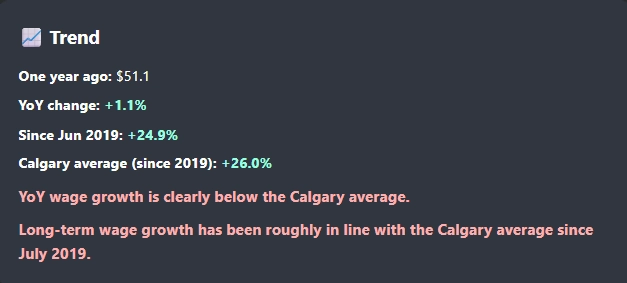
For this industry:
- One year ago: $51.10/hour
- Year-over-year change: +1.1%
- Since June 2019: +24.9%
- Calgary average since 2019: +26.0%
This suggests two things:
- Recent wage growth in this industry is clearly below the Calgary average
- Long-term wage growth has been roughly in line with the city average since 2019
So even strong-sounding industries do not necessarily deliver equally strong wage momentum every year.
4) Industry size changes the meaning
Another useful piece of context is industry size.
A gap in a tiny niche sector matters differently from a gap in a major Calgary industry.

In this example:
- Employment: 95.9k workers
- Share of all industries: 11.0%
That is a large segment of Calgary’s labour market, which means the wage pattern here is not a niche story. It affects a significant part of the city’s workforce.
5) Why this feels personal
Wage data matters because it is not abstract.
People compare their pay with rent, groceries, commute costs, and long-term career choices.
Even a few dollars per hour can feel very different once you compare it with the going rate in your own field.
That is why a tool like this can be useful. It turns a vague feeling into a specific benchmark.
6) So I built a simple tool
To make this easier to understand, I built a Calgary wage comparison tool.
It helps answer a few practical questions:
- How does your hourly wage compare with your industry average?
- How does it compare with Calgary as a whole?
- How has that industry changed over time?
- How large is the industry in the local labour market?
Explore the interactive version here:
📍 Calgary Wage Comparison Tool →
Try your own wage and industry to see how the numbers compare.
7) How to read the result
- Below industry average does not automatically mean someone is underpaid in a strict legal or HR sense
- Above Calgary average does not necessarily mean strong wage growth
- The most useful way to read the result is as a labour market benchmark, not a final judgment
The goal is not to label a wage as “good” or “bad” in isolation. The goal is to provide a clearer frame of reference.
8) Final thought
Most people know what they earn.
But far fewer know where they stand.
Sometimes, the difference between those two things is bigger than expected.
 Share on LinkedIn
 Share on X
 Share via Email