
Calgary Crime Map & Community Safety Dashboard
Explore how crime patterns are changing across Calgary communities through interactive maps, historical trends, and community-level safety analytics.
Crime & Disorder Insights — Calgary’s crime patterns, disorder, and city benchmarking.
Explore Calgary crime and disorder insights through community crime maps, neighbourhood safety trends, disorder pressure dashboards, and Crime Severity Index comparisons across major Canadian cities.
Explore how crime patterns are changing across Calgary communities through interactive maps, historical trends, and community-level safety analytics.

Disorder indicators by community with time-series context, offering another lens on safety, livability, and local pressures across Calgary.

Compare Calgary with Canada and peer cities using Total, Violent, and Non-violent Crime Severity Index trends from 1998 to 2024. Click any dashboard element to filter the other charts.
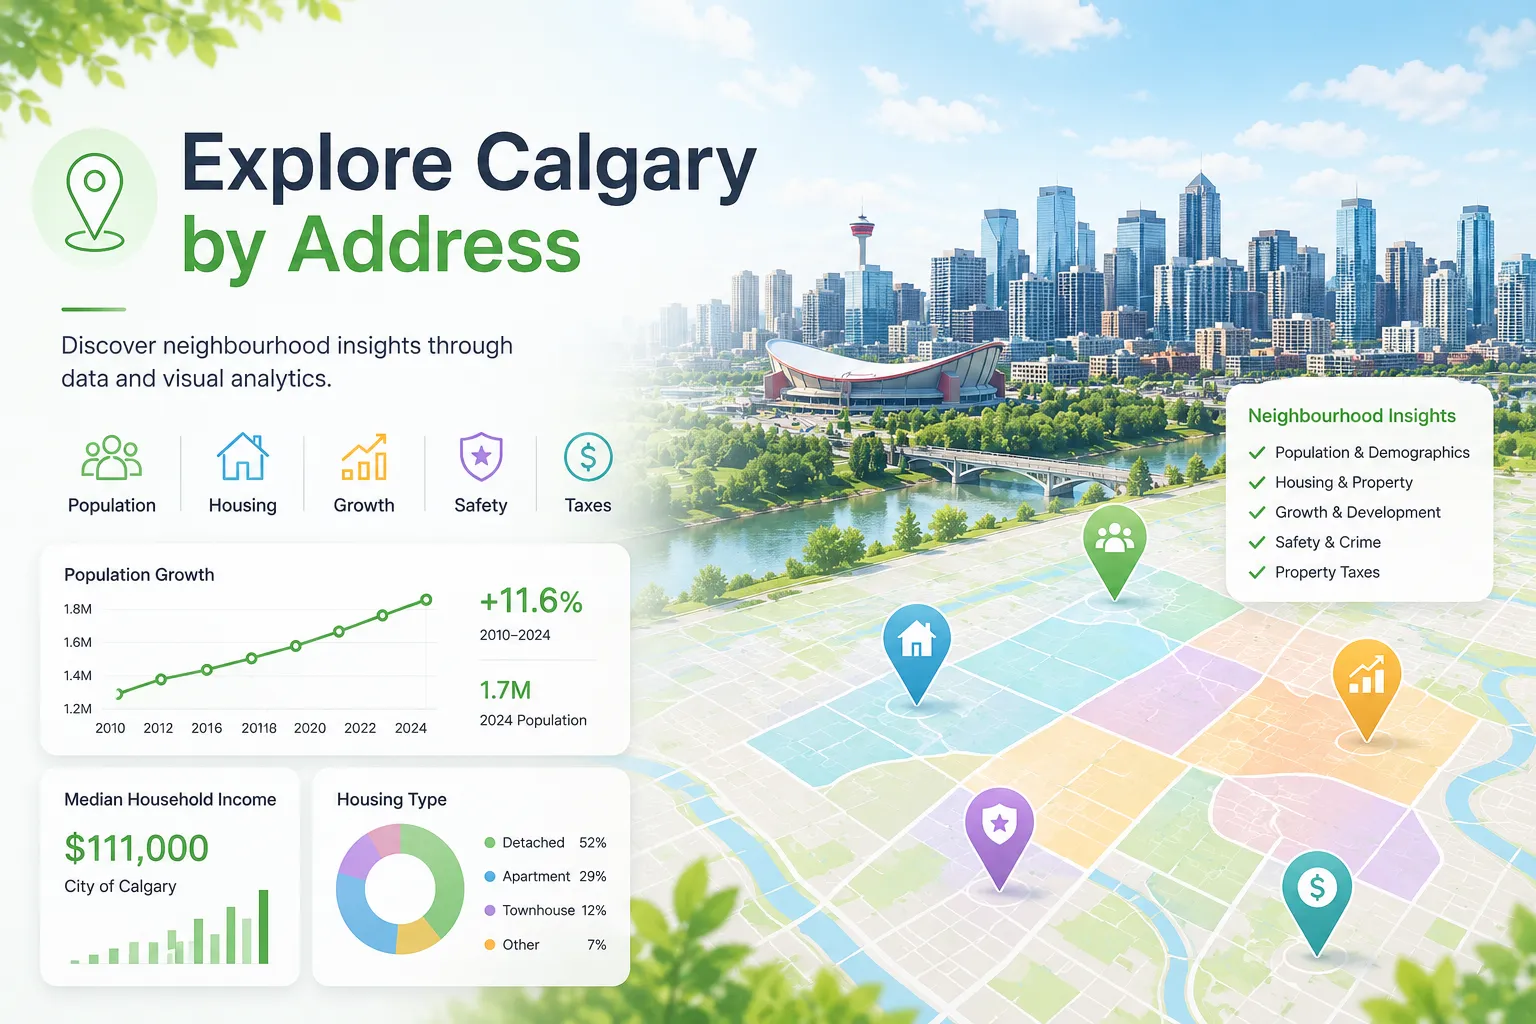
Explore schools, daily accessibility, property history, crime trends, taxes, and community insights from a single address.
YYC-Wander Crime & Disorder Insights helps Calgary residents, researchers, home buyers, community observers, and local organizations explore crime, disorder, 311 service request, and safety-related data.
This section brings together Calgary community crime maps, disorder pressure dashboards, neighbourhood-level historical trends, 311 issue patterns, and Crime Severity Index comparisons across major Canadian cities.
This section covers Calgary community crime trends, disorder pressure indicators, 311 service request patterns, and Crime Severity Index benchmarks.
Yes. Several dashboards support community-level comparison for crime, disorder, and neighbourhood issue patterns.
Yes. The Crime Severity Index dashboard compares Calgary with Canada and peer cities using long-term CSI trends.
Yes. These dashboards help users review historical trends and compare multiple safety and livability indicators across Calgary communities.