
Industry Explorer
Explore Calgary wage trends, employment growth, and business survival patterns by industry.
Economy & Energy Insights — Calgary and Alberta through labour, business, and oil cycles.
Explore Calgary and Alberta economy insights through labour market trends, wage growth, employment by industry, business survival, business structure, migration patterns, and energy-driven economic cycles.
Explore Calgary wage trends, employment growth, and business survival patterns by industry.

Explore how Alberta’s oil economy connects with jobs, migration, housing construction, and rental market pressure.

See how Calgary’s labour market shifts across industries — year-over-year changes plus a year-specific pie to quickly read which sectors are gaining or losing share.

See how hourly wages compare across Calgary industries, with trends and YoY change.

Compare total businesses, new businesses, and estimated 1Y / 3Y / 5Y survival rates across Calgary, Edmonton, Red Deer, Lethbridge, Airdrie, and St. Albert.
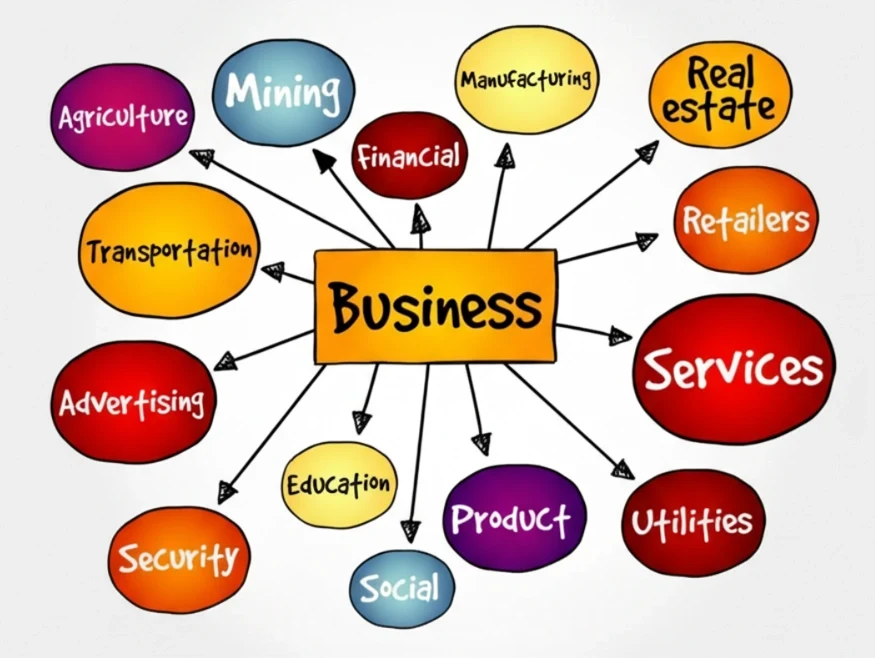
Explore how Alberta’s business landscape is composed by industry. Use the year slider and city buttons to compare Calgary, Edmonton, Red Deer, Lethbridge, Airdrie, and St. Albert — trend lines plus a year-specific pie for clear composition.

See how your pay compares across Calgary and how it has changed (2019–2026).

How Alberta’s population flows respond to oil cycles: comparing long-run net migration with WTI oil price movements.
YYC-Wander Economy & Energy Insights helps residents, job seekers, business owners, researchers, and community observers explore Calgary and Alberta economic trends.
This section brings together wage trends, employment by industry, business survival, business classifications, migration patterns, labour market indicators, and Alberta energy-cycle relationships.
This section covers Calgary and Alberta labour markets, wages, business activity, migration, and energy-linked economic indicators.
Yes. Several dashboards compare employment, wages, business counts, and survival rates across industries.
Yes. The Alberta Economic Cycle Explorer examines relationships between oil prices, migration, housing activity, and economic conditions.