YYC-Wander
Home → Civic & Social Analytics → Community Density
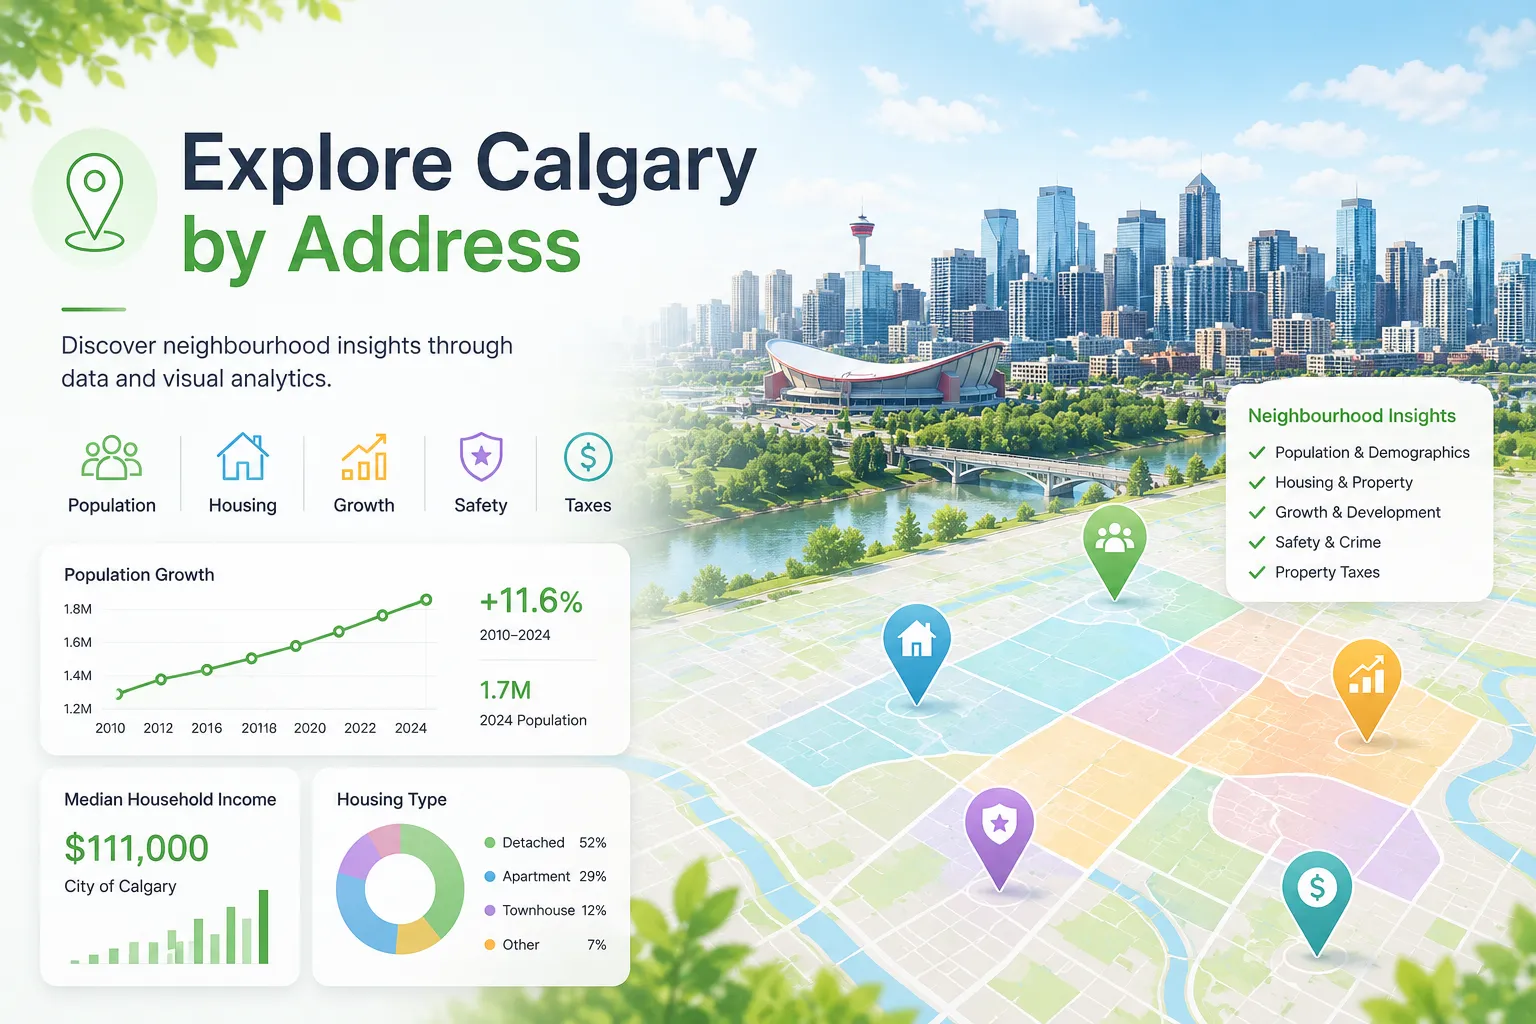
Calgary Neighbourhood Density (Population & Housing)
Explore Calgary neighbourhood density, population per km², residential properties per km², housing density, and community comparison across Calgary. Compare regions, understand how compact each neighbourhood is, and identify urban density patterns.
Explore Related Insights


About Calgary Neighbourhood Density Dashboard
About Calgary Neighbourhood Density Dashboard
YYC-Wander Calgary Neighbourhood Density Dashboard helps residents, home buyers, researchers, and community planners compare population density, housing density, residential property concentration, and urban structure patterns across Calgary communities.
The dashboard shows population per square kilometre and residential properties per square kilometre at the community level, making it easier to compare how compact, dense, or spread out different Calgary neighbourhoods are.
What Information Is Included?
- Calgary neighbourhood population density
- Population per km² by community
- Residential properties per km² by community
- Housing density comparison
- Community sector filters
- Neighbourhood-level density rankings
- People-per-home proxy comparison
- Calgary urban structure and community density patterns
Frequently Asked Questions
What does Calgary neighbourhood density mean?
Neighbourhood density compares how many people or residential properties are located within each square kilometre of a Calgary community.
How can I compare Calgary communities by density?
Use the community sector and community name filters to compare population per km², residential properties per km², and housing density across Calgary neighbourhoods.
What is the difference between population density and housing density?
Population density shows people per km², while housing density shows residential properties per km². Comparing both can reveal differences in household size, housing form, and neighbourhood structure.
Can this help with Calgary neighbourhood research?
Yes. This dashboard can help users understand compact neighbourhoods, lower-density suburban areas, housing concentration, and community-level urban patterns in Calgary.