YYC-Wander
Home → Civic & Social Analytics → CBE School Capacity & Utilization
CBE School Capacity & Utilization (2015–2026)
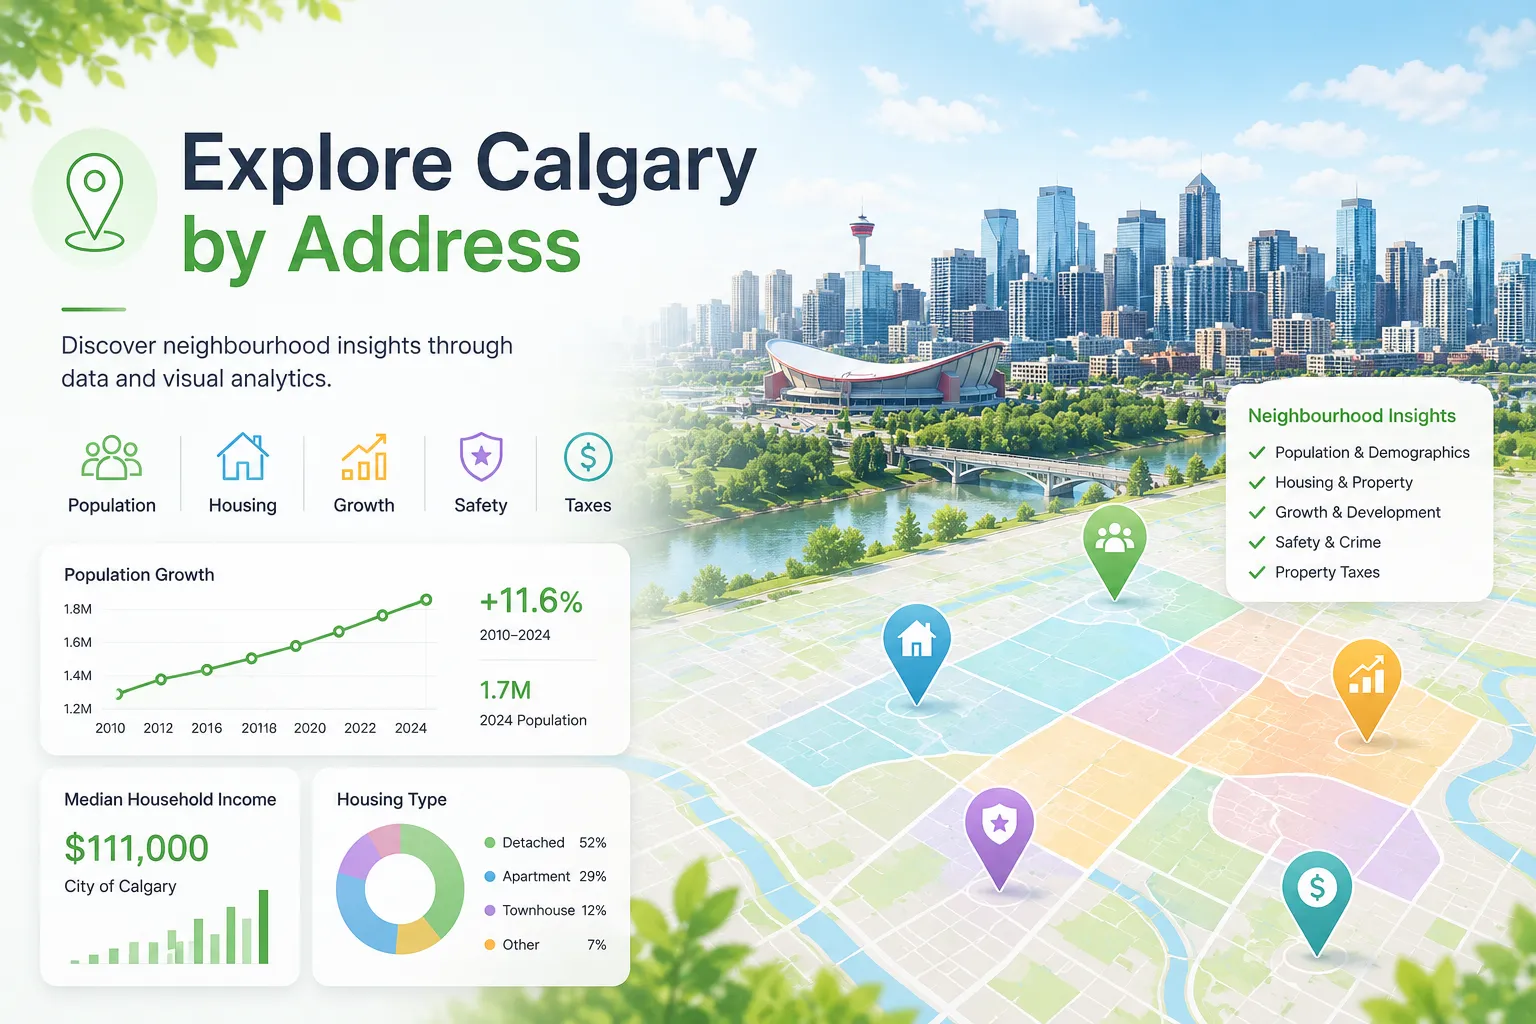
Explore Calgary Board of Education (CBE) school capacity, utilization rates, weighted capacity, portable classrooms, enrolment pressures, and school growth trends from 2015 to 2026. Compare schools across Calgary quadrants and identify capacity hotspots.
Explore Related Insights

About Calgary CBE School Capacity Dashboard
About Calgary CBE School Capacity Dashboard
YYC-Wander Calgary CBE School Capacity Dashboard helps parents, students, home buyers, and Calgary residents explore school capacity, weighted capacity, utilization rates, portable classrooms, enrolment pressures, and school growth trends across Calgary communities.
The dashboard includes Calgary Board of Education school capacity and utilization data from 2015 to 2026, allowing users to compare schools, quadrants, taught types, and long-term capacity trends.
What Information Is Included?
- Calgary Board of Education school capacity
- CBE weighted capacity
- CBE school utilization rates
- Portable classroom counts
- School-year trends from 2015 to 2026
- Elementary, junior high, senior high, and other taught-type comparisons
- Calgary quadrant comparisons
- School capacity map and utilization trend chart
Frequently Asked Questions
What is school utilization rate?
Utilization rate compares student enrolment or weighted capacity with school capacity and helps identify schools that may be crowded or underused.
How can I compare Calgary CBE schools?
Use the school year, quadrant, school name, and taught-type filters to compare utilization rates, weighted capacity, portable classrooms, and school growth trends.
Does this dashboard include 2026 CBE school capacity data?
Yes. This Calgary CBE school capacity dashboard includes school-year data through 2025–2026 where available.
Can this help with Calgary school and neighbourhood research?
Yes. The dashboard can help residents understand school capacity pressure, compare Calgary quadrants, and explore school-level trends before reviewing specific neighbourhoods or addresses.