Home → Crime & Disorder Insights → Calgary Community Crime Dashboard
Calgary Community Crime Rate (2017-2026)
Notes & methods
- Scope: Calgary community-level crime records (2017-01 -- 2026-03).
- Rate: crime cases per 1,000 residents, shown only when community population is available.
- Source: Calgary Open Data.
- Data updated: 2026-05.
- Interpretation: Crime rates reflect reported incidents occurring within a community area and do not imply that crimes were committed by local residents.
Explore Related Insights
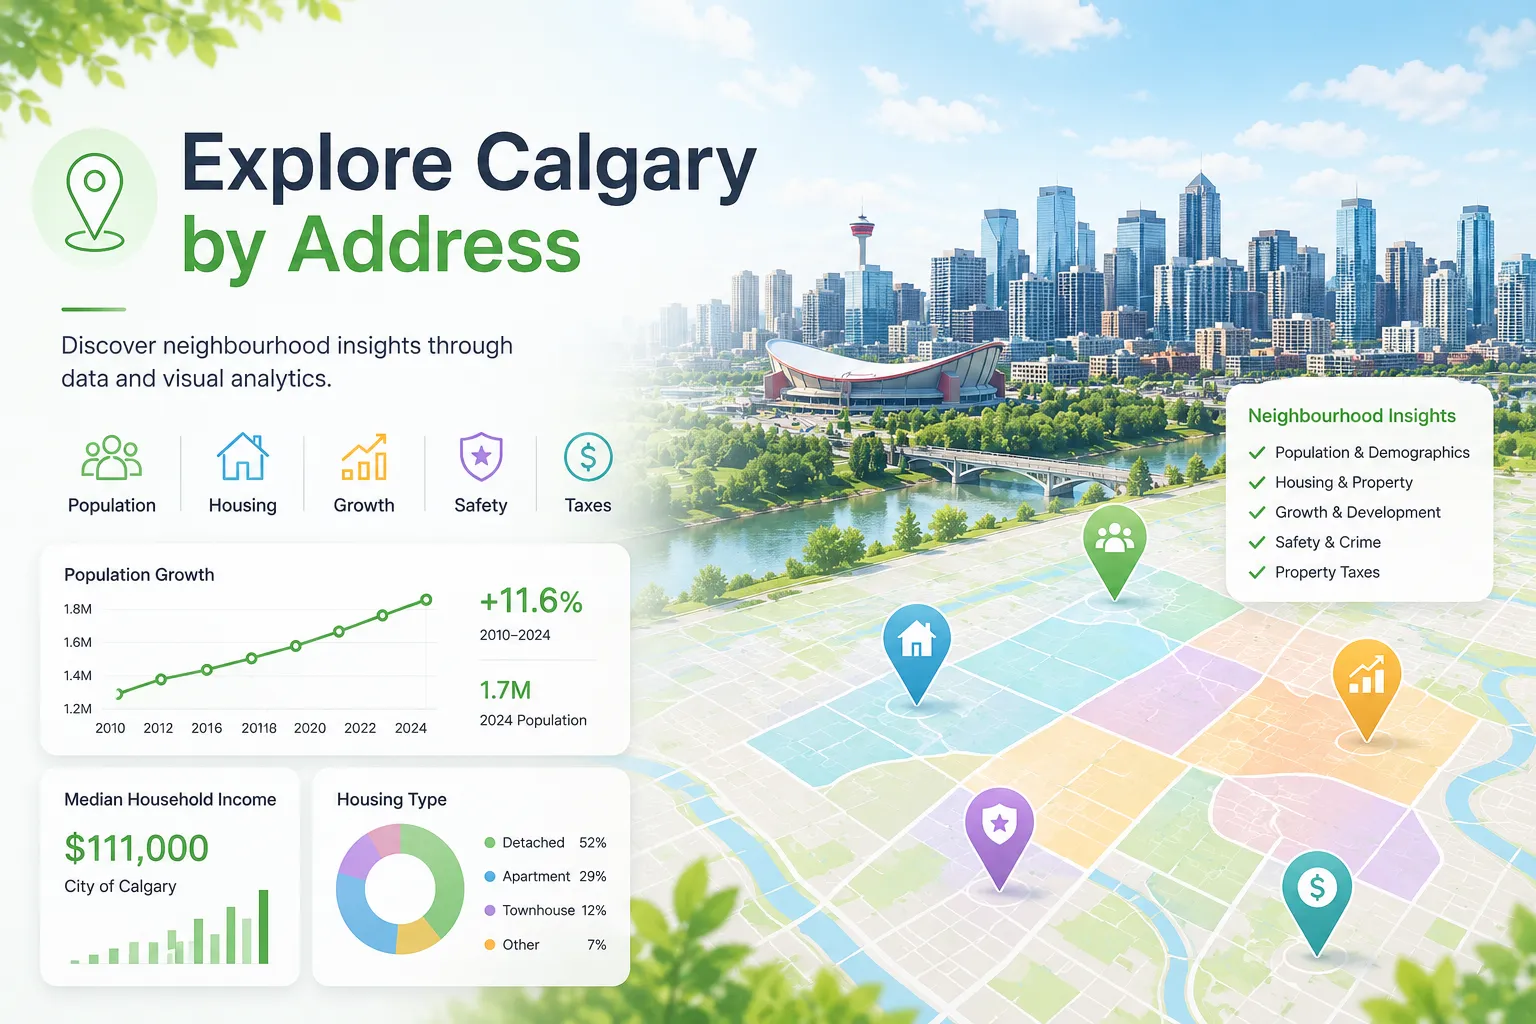
Calgary Address Explorer
Explore crime, schools, density, taxes, and housing insights around a specific Calgary address.

Community Disorder Pressures
Analyze disorder-related community pressures and compare trends across Calgary neighbourhoods.
Community Population & Housing
Compare Calgary communities by population density, housing density, and residential growth patterns.

Crime Severity Index
Explore long-term Calgary crime severity trends and compare changes across different crime categories.