Home → Crime & Disorder Insights → Calgary Community Crime Dashboard
Calgary Crime Map & Community Safety Dashboard
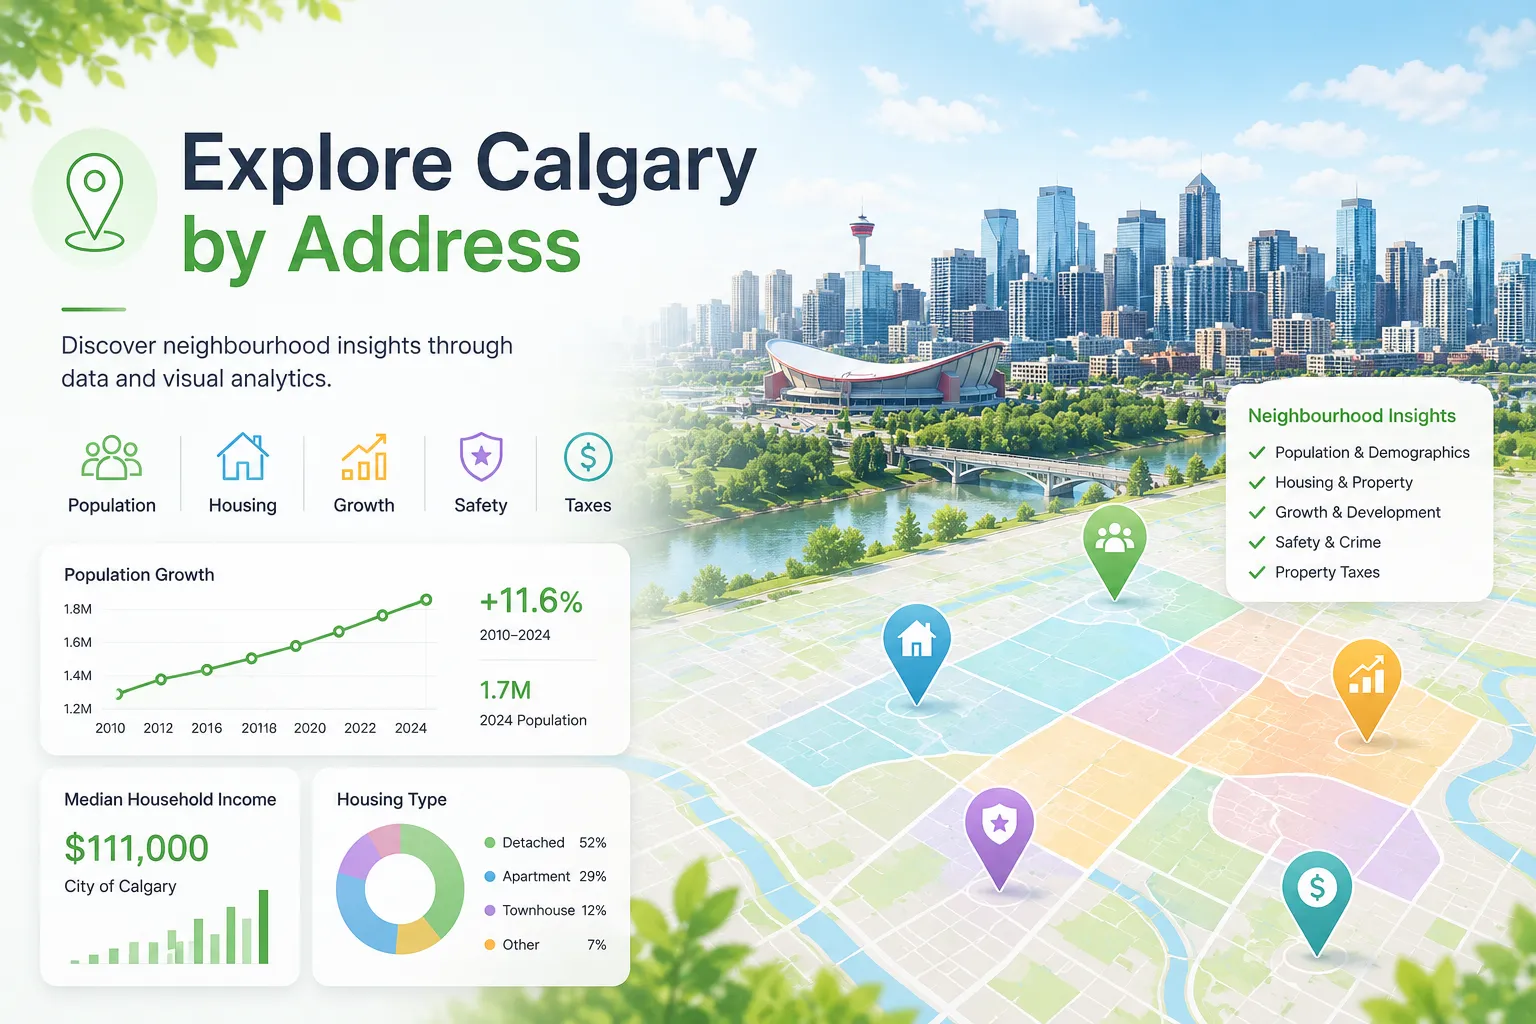
Explore Calgary community crime trends from 2017 to 2026 through an interactive crime map and community safety dashboard. Compare neighbourhood crime rates, long-term trends, and Calgary safety patterns across communities.
Explore Related Insights


About Calgary Crime Map 2026
About Calgary Crime Map 2026
YYC-Wander Calgary Crime Map 2026 helps residents explore community crime trends, neighbourhood safety patterns, crime rates, and historical crime statistics across Calgary communities.
The dashboard includes Calgary community crime data from 2017 through 2026, allowing users to compare recent crime activity with long-term historical trends across Calgary neighbourhoods.
What Information Is Included?
- Calgary community crime rate map
- Neighbourhood crime rate comparisons
- Community crime rankings
- Monthly crime case trends
- Crime category breakdowns
- Calgary median crime rate comparison
- Historical crime statistics from 2017 to 2026
- Community safety indicators across Calgary neighbourhoods
Frequently Asked Questions
Which Calgary communities have the highest crime rates?
The dashboard ranks Calgary communities by crime cases per 1,000 residents where population data is available.
How is the Calgary crime rate calculated?
Crime rate is calculated as reported crime cases per 1,000 residents for each Calgary community where population data is available.
Can I compare Calgary crime trends by community?
Yes. You can filter by area, community, crime category, and month range to compare crime trends across Calgary neighbourhoods.
Does this dashboard include 2026 Calgary crime data?
Yes. This Calgary crime dashboard includes data through 2026 where available, together with historical community crime trends dating back to 2017.