Home → Housing Market Insights → Community Housing Median Assessed Value
Calgary Community Housing Values 2026 | Median Assessed Value by Type
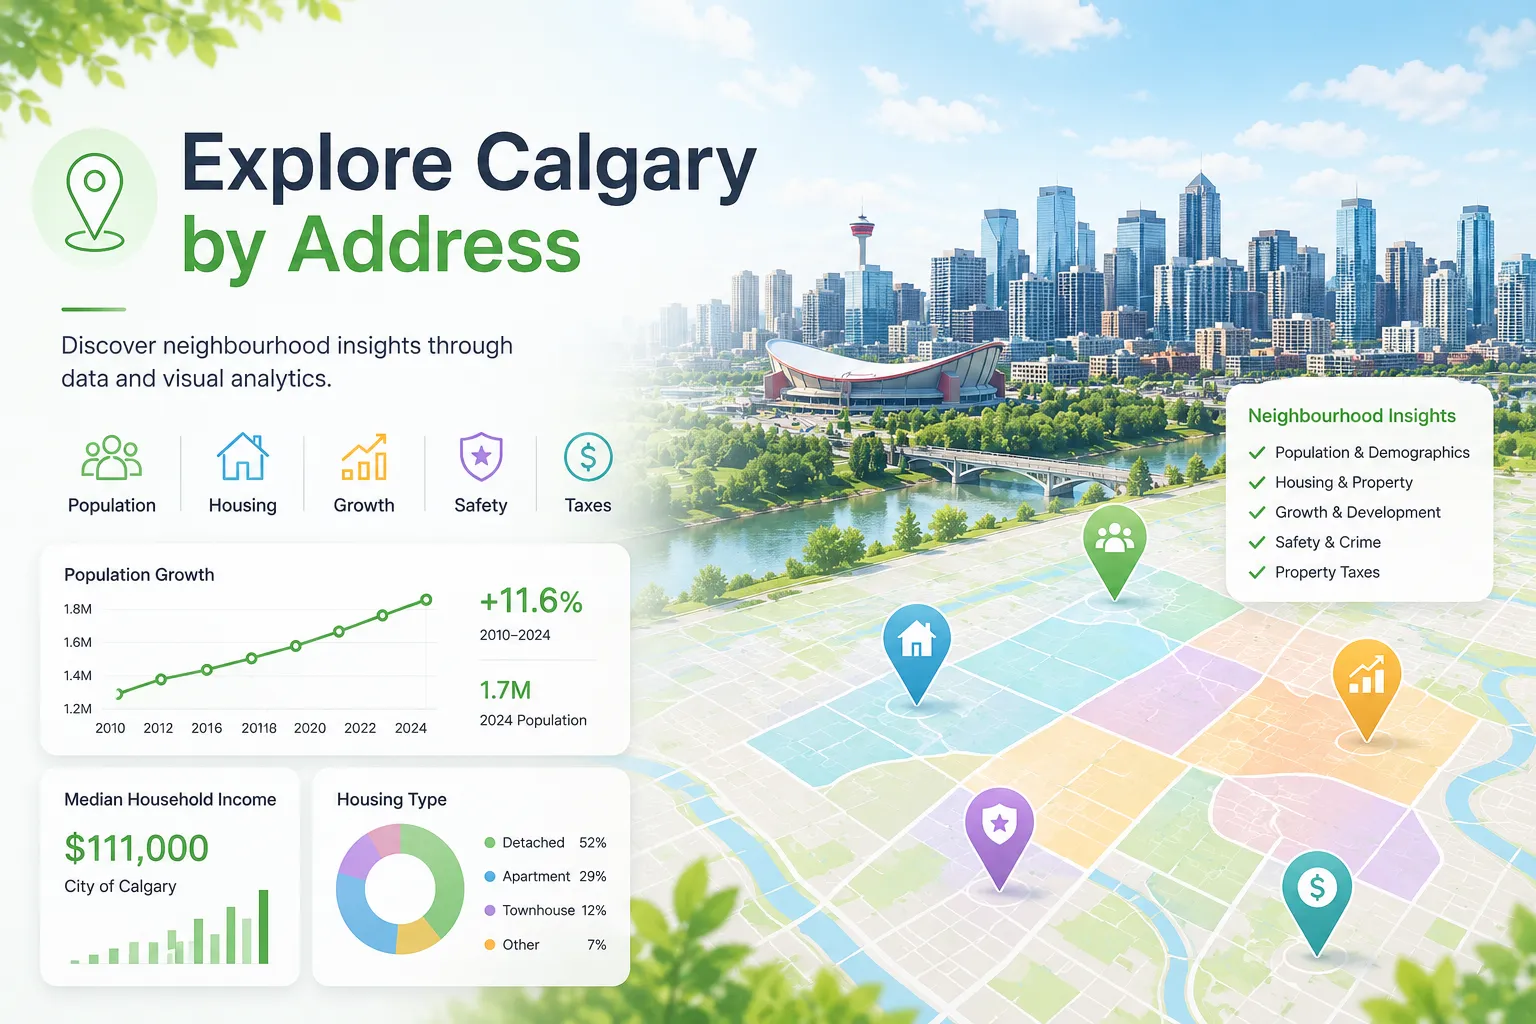
Explore Calgary community housing values, median assessed values, property type comparisons, and neighbourhood housing trends using 2026 Calgary assessment data. Compare detached homes, apartments, townhouses, duplexes, and other housing types across Calgary communities.
Explore Related Insights

About Calgary Community Housing Values 2026
About Calgary Community Housing Values 2026
YYC-Wander helps home buyers, sellers, investors, researchers, and Calgary residents compare median assessed housing values across Calgary communities.
The dashboard compares housing values by property type, including detached homes, apartments, townhouses, duplexes, and other residential property categories.
What Information Is Included?
- Median assessed value by housing type
- Calgary community housing values
- Detached home values
- Apartment and condo values
- Townhouse values
- Community-level housing comparisons
- Sector-level housing analysis
- 2026 Calgary assessment insights
Frequently Asked Questions
How can I compare Calgary housing values?
Select a sector, community, and property type to compare median assessed values.
What housing types are included?
The dashboard includes detached homes, apartments, townhouses, duplexes, and other housing categories.
What does median assessed value mean?
Median assessed value represents the middle assessed value within a selected housing type and community.
Can this help with Calgary housing research?
Yes. It provides a quick way to compare property values across communities and housing forms.