Home → Housing Market Insights → Community Housing Type Mix
Community Housing 1 · Type Mix | Calgary (2026)
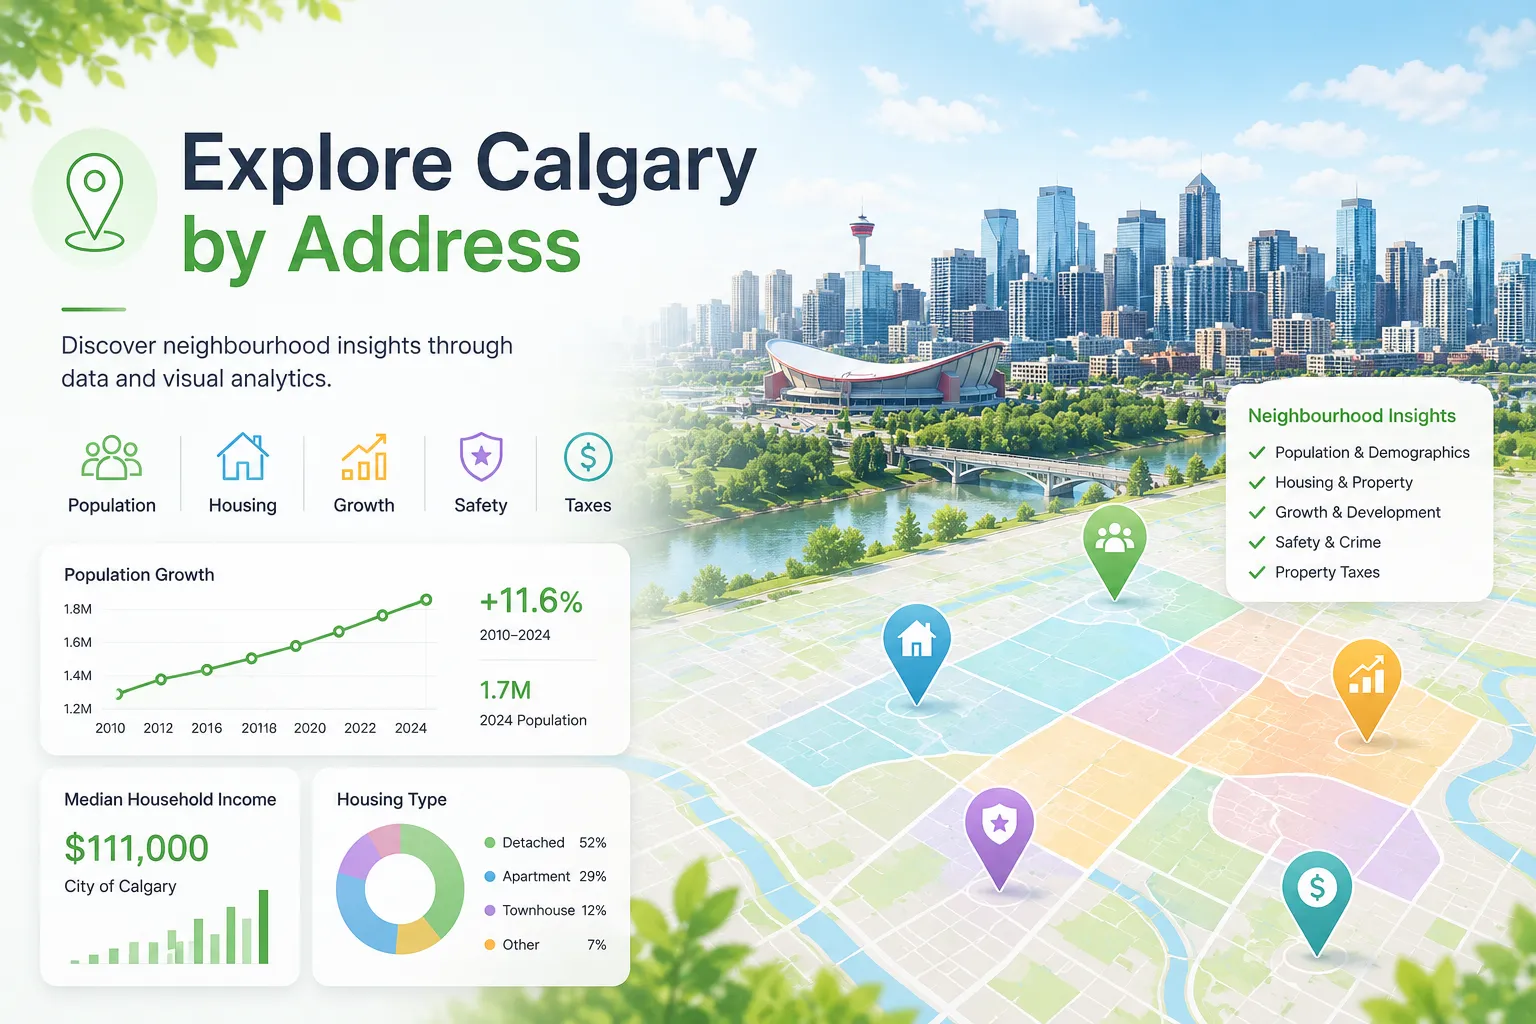
Explore Calgary community housing type mix in 2026, including detached homes, apartments, townhouses, duplexes, condos, and other housing structures. Compare neighbourhood housing patterns by sector and community using interactive charts.
 Share on X
 Share on LinkedIn
 Share via Email
Explore Related Insights

About Calgary Community Housing Type Mix 2026
About Calgary Community Housing Type Mix 2026
YYC-Wander Calgary Community Housing Type Mix dashboard helps residents, home buyers, researchers, planners, and community observers understand the housing structure of Calgary neighbourhoods.
The dashboard compares Calgary communities by housing type, including detached homes, apartments, townhouses, duplexes, condos, and other residential structures. Users can filter by sector and community to explore how housing form differs across Calgary.
What Information Is Included?
- Calgary community housing type mix
- Detached home share by community
- Apartment and condo housing patterns
- Townhouse and duplex comparisons
- Housing structure by Calgary neighbourhood
- Sector-level housing mix comparison
- Top housing types and Others grouping
- 2026 Calgary community housing insights
Frequently Asked Questions
What does housing type mix mean?
Housing type mix shows the distribution of residential housing forms in a community, such as detached homes, apartments, townhouses, duplexes, and other property types.
Can I compare Calgary communities by housing structure?
Yes. Use the sector and community filters to compare housing type counts and shares across Calgary neighbourhoods.
What does Top 6 + Others mean?
When many housing categories are present, the chart shows the six largest housing types and groups smaller categories into Others to keep the visualization readable.
Can this help with Calgary neighbourhood research?
Yes. Housing type mix can help users understand whether a neighbourhood is mostly detached homes, apartments, townhouses, duplexes, or a more mixed housing environment.