Home → Calgary Address → Carrington → 323 CARRINGVUE WY NW
323 CARRINGVUE WY NW, Calgary
323 CARRINGVUE WY NW is a townhouse home built in 2018, located in Carrington, Calgary. Explore schools, daily and 15-minute accessibility, public transit, traffic safety, crime and disorder trends, nearby development, flood risk, fire protection, 311 service requests, tree canopy, housing history, assessment values, and property taxes.
Free interactive maps, detailed comparisons, and the latest available data.
🏫 School Accessibility & Capacity
This address has higher CBE utilization but stronger daycare capacity. Highest assigned-school utilization is 126%, while closest daycare records provide 217 licensed spaces.
🎓 School Performance
School Performance varies strongly by grade band. Monsignor Neville Anderson School records 84.1 for Grade 6, while Nose Creek School records 66.3 for Grade 6. School rankings should be read as one indicator only, alongside school fit, program availability, transportation, learning supports, and family needs.
🚗 Daily Accessibility
Downtown access is slower than the Calgary median for this address. The daily-access profile depends more on local destinations than downtown access.
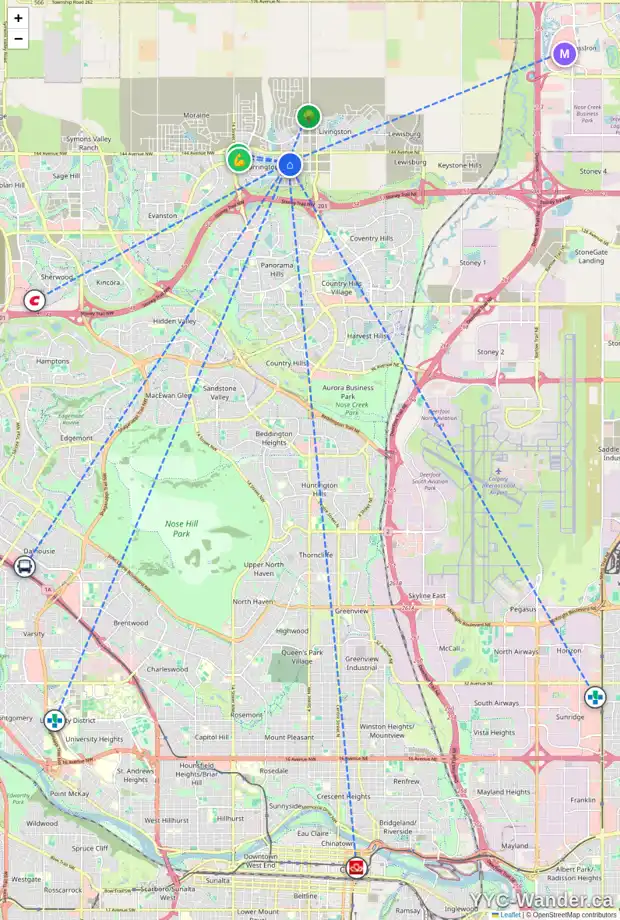
Click the map to explore the interactive version.
🧭 15-Minute Living Profile
Modelled access is limited across multiple destination groups for this address.
🚌 Nearby Bus Transit
Nearby bus access combines EB 144 AV @ Carringvue DR NW with a mixed community and Calgary benchmark profile.
👥 Community Profile
Carrington combines higher household income with stronger university certificate or degree attainment.
🏘️ Community Density
Carrington has a population density of 920 people per km^2 and a residential density of 298 residential units per km^2. Compared with the Calgary community median, population density is 64.8% below and residential density is 72.3% below.
🌳 Nearby Tree Canopy Coverage
Mapped canopy coverage is 0.7%, which is stronger than the local median and lower than the city-wide benchmark.
🌊 Flood Context & 🚒 Fire Protection Access
For this address, flood context is outside mapped floodplain. Fire protection access shows 3.2 min to the nearest station and 49 m to the nearest City-owned hydrant.
🚓 Crime Trends
Crime Trends for this address are based on community-level records. The current profile is much higher than median, the 12-month profile is much higher than median, and month-to-month variation is high.
📍 Disorder & Community Pressure
Carrington recorded a higher latest-month disorder pressure than the Calgary median, with Suspicious Vehicle, Disturbance, and Drugs among the common reported issues.
🚦 Nearby Traffic Safety Incidents
The matched records include recent activity, and the closest record is dated February 11, 2026.
☎️ 311 Service Requests
Over the available 12-month window, Carrington averaged 33.17 311 requests per 1,000 residents. The 12-month comparison is 104.9% above the Calgary median, while the recent direction is declining.
🏗️ Nearby Development Permits
The closest matched Development Permit location is within 150 metres of this address, at about 131 m. Permit type and current recorded status should be read as separate facts.
🧱 Building Permit History
Building Permit history for this address includes Improvement work classifications in the available City records.
🏚️ Housing History
This address has building-permit activity in the static bundle, adding renovation or work-history context to the year-built record.
💰 Property Value & Tax History
The latest assessed value is close to the community median for similar townhouse properties in Carrington. The latest value is $519,500.
See the Full Picture for 323 CARRINGVUE WY NW
This page provides a quick overview of 323 CARRINGVUE WY NW. For a complete interactive experience, open the YYC-Wander Address Explorer to explore maps, school details, flood context, fire access, assessment history, crime trends, community insights, and more.
Some interactive features and the latest available property information are only available in the YYC-Wander Address Explorer.
Free to explore.