Home → Calgary Address → Copperfield → 253 COPPERFIELD MR SE
253 COPPERFIELD MR SE, Calgary
253 COPPERFIELD MR SE is a detached home built in 2004, located in Copperfield, Calgary. Explore schools, daily and 15-minute accessibility, public transit, traffic safety, crime and disorder trends, nearby development, flood risk, fire protection, 311 service requests, tree canopy, housing history, assessment values, and property taxes.
Free interactive maps, detailed comparisons, and the latest available data.
🏫 School Accessibility & Capacity
This address has higher school-capacity pressure but stronger childcare support. Highest CBE utilization is 105%, and daycare capacity totals 124 spaces.
🎓 School Performance
School Performance for this address includes multiple grade-band records within the matched school set, so grade level should be reviewed separately. School rankings should be read as one indicator only, alongside school fit, program availability, transportation, learning supports, and family needs.
🚗 Daily Accessibility
This address appears more car-dependent in the static route data. Daily Accessibility depends more on car routes than pedestrian or LRT access.
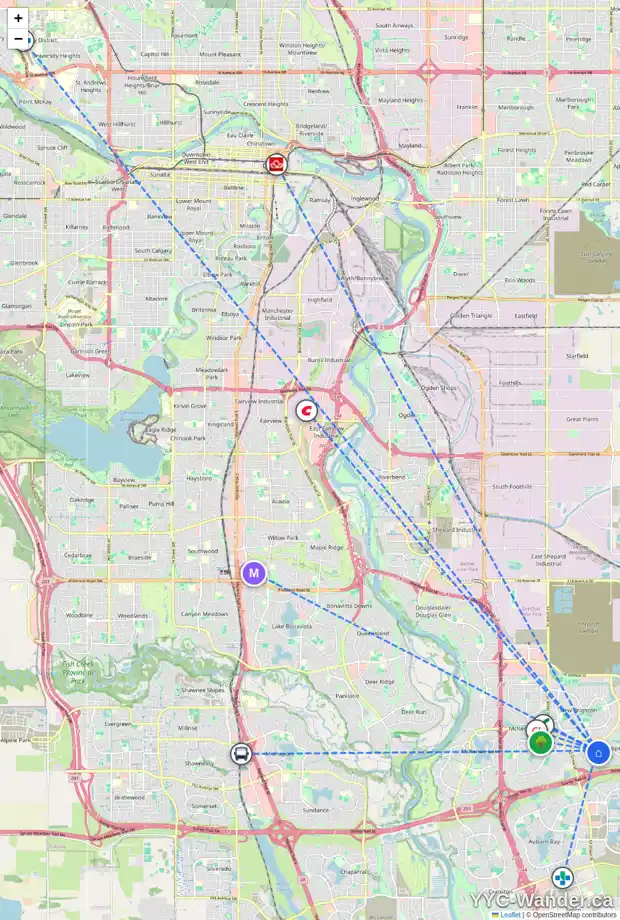
Click the map to explore the interactive version.
🧭 15-Minute Living Profile
Routine grocery access stands out among the available destination groups.
🚌 Nearby Bus Transit
Nearby bus access at this address is broadly consistent with the typical level in Copperfield.
👥 Community Profile
Education and diversity indicators are both lower than the Calgary comparison point here.
🏘️ Community Density
Copperfield has a population density of 3,057 people per km^2 and a residential density of 1,095 residential units per km^2. Compared with the Calgary community median, population density is 16.9% above and residential density is 1.8% above.
🌳 Nearby Tree Canopy Coverage
Canopy coverage here is 0.7 percentage points below the community median and 4.6 percentage points below the Calgary median.
🌊 Flood Context & 🚒 Fire Protection Access
The combined safety profile shows outside mapped floodplain, typical fire-station access, and typical hydrant access.
🚓 Crime Trends
The latest Crime Trends snapshot shows Copperfield at 0.43 per 1,000 residents in 2026-06. That is 47.6% below the Calgary median, with violence-related incidents most common in the latest month.
📍 Disorder & Community Pressure
In the latest available month, community-level reported disorder pressure was lower than the Calgary median. Common reported issues included Disturbance, Drugs, and Indecent Act.
🚦 Nearby Traffic Safety Incidents
No matching traffic-safety records were found within 500 metres of this address in the current dataset.
☎️ 311 Service Requests
Over the available 12-month window, Copperfield averaged 10.85 311 requests per 1,000 residents. The 12-month comparison is 33.0% below the Calgary median, while the recent direction is declining.
🏗️ Nearby Development Permits
The current search matched 5 permits within 400 metres, with 0 permits within 150 metres. The records are public permit matches, not a construction-status update.
🧱 Building Permit History
The address-level Building Permit data includes Improvement work context, with the latest record dated April 27, 2005.
🏚️ Housing History
The latest permit year is not recent, so this section treats permits as historical property context.
💰 Property Value & Tax History
Calgary-wide comparison places this property below the city median for its recorded house type.
See the Full Picture for 253 COPPERFIELD MR SE
This page provides a quick overview of 253 COPPERFIELD MR SE. For a complete interactive experience, open the YYC-Wander Address Explorer to explore maps, school details, flood context, fire access, assessment history, crime trends, community insights, and more.
Some interactive features and the latest available property information are only available in the YYC-Wander Address Explorer.
Free to explore.